How Integrated Analytics Tools Help Users Track Performance Metrics Across Various Licensed Wagering Applications
Written by Yara Berger · Jul 20, 2026
How Integrated Analytics Tools Help Users Track Performance Metrics Across Various Licensed Wagering Applications
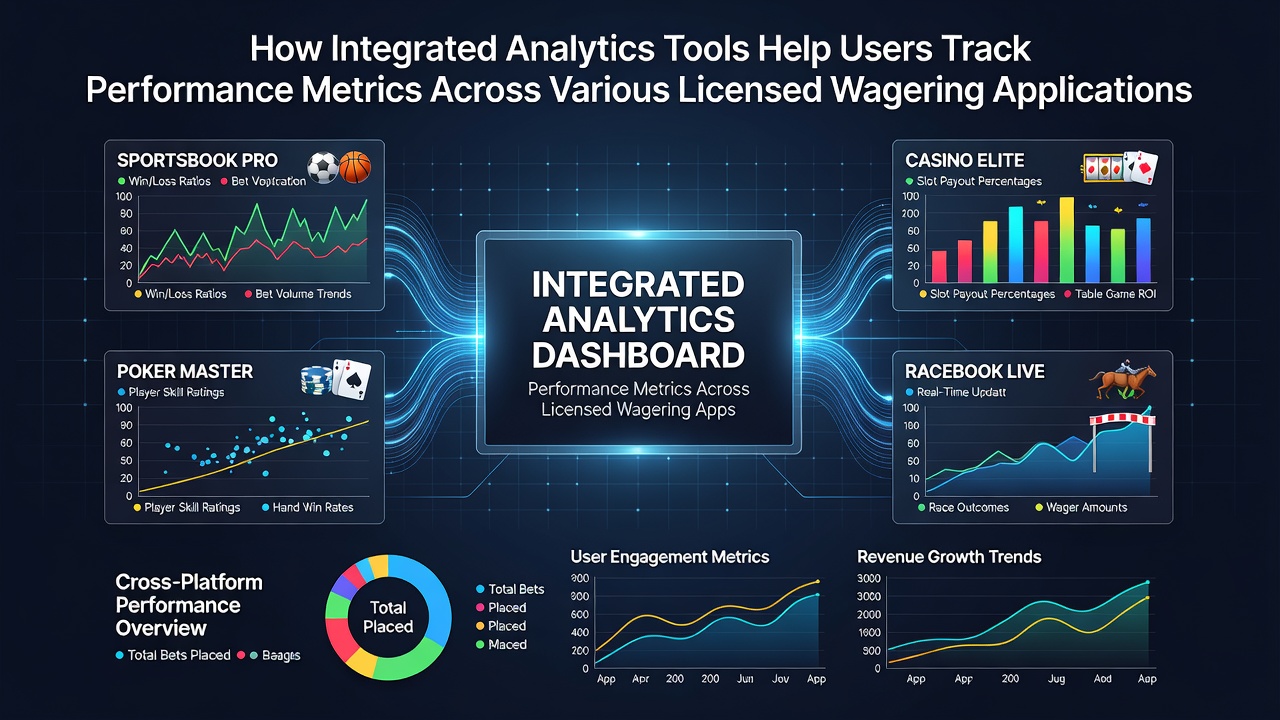
Integrated analytics tools now sit at the center of many licensed wagering platforms, pulling together data streams from separate applications so users can monitor their own activity in one place. These systems compile metrics such as win rates, return on investment, and session lengths without requiring manual entry across each app. Operators have built the tools to meet regulatory standards that require clear record-keeping, while users gain visibility into patterns that span several operators.
Core Functions of Cross-Platform Tracking
Most tools connect through APIs that licensed operators expose for compliance and user reporting purposes. Once linked, the software aggregates bet histories, calculates aggregate profit-and-loss figures, and breaks results down by sport, market type, or time period. Data from July 2026 shows continued growth in these connections, particularly as more states finalize multi-state compacts that allow operators to share limited user data under strict privacy rules.
Users see standardized dashboards that list key performance indicators side by side. One screen might display overall ROI across five different apps while another tab isolates results from live markets only. The same interface often flags streaks or variance measures that help people review their own activity against historical benchmarks supplied by the platform.
Data Sources and Regulatory Backing
State regulators supply the underlying transaction records that feed these systems. The New Jersey Division of Gaming Enforcement publishes monthly handle and hold-percentage reports that analytics providers reference when calibrating their benchmarks. Similar data streams from regulators in other jurisdictions allow tools to normalize figures across borders where licensing rules differ.
Industry groups such as the European Gaming and Betting Association have published technical standards for data export formats, making it easier for third-party analytics firms to ingest information from multiple operators without custom coding for each one. Those standards cover fields such as stake size, odds at placement, and settlement status so comparisons remain consistent.
Practical Examples of Metric Tracking
Take one user who places wagers on both a major sportsbook and a smaller regional app. The analytics layer pulls daily settlement files from each, then displays a combined profit curve that updates every few minutes during live events. The same user can filter results to see whether in-play betting on soccer produces different returns than pre-match bets on basketball, all within the single interface.
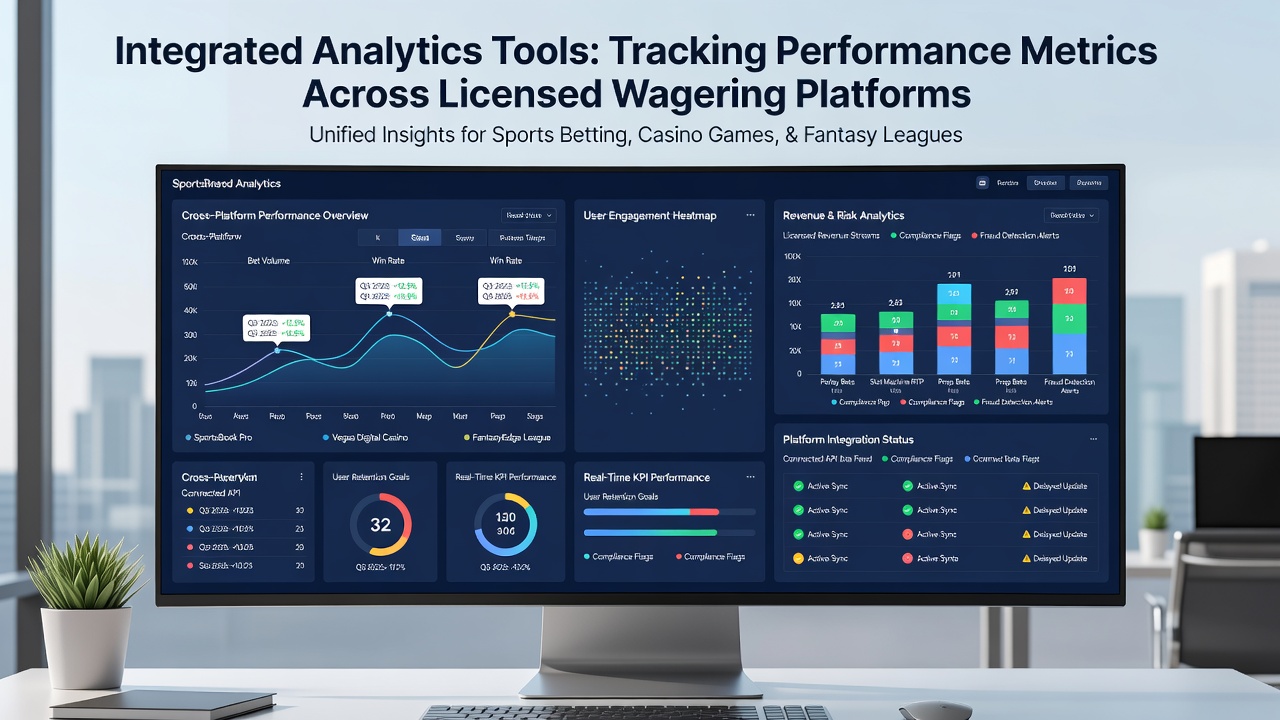
Another common view ranks bet categories by volume and success rate. Charts update automatically when new settlements arrive, so users do not need to export spreadsheets from each app. Some platforms add alerts that trigger when a chosen metric crosses a threshold the user set in advance, such as a drop in ROI over a rolling seven-day window.
Security and Privacy Controls
Because the tools handle financial data, they operate under the same encryption and access rules that govern the wagering apps themselves. Two-factor authentication and role-based permissions limit who can view aggregated reports. Operators log every data pull so regulators can audit usage if questions arise about responsible-gambling compliance.
Users control which apps they connect and can revoke access at any time. The analytics provider receives only the fields needed for the chosen metrics, and most delete raw transaction details after a set retention period required by licensing agreements.
Future Developments Expected by Late 2026
Work continues on standardized identifiers that would let users move their analytics profiles between different tool providers without re-entering historical data. Several operators have already begun pilot programs that test real-time metric updates during live events, shortening the lag between bet settlement and dashboard refresh. Observers note that continued regulatory clarity around data portability will determine how quickly these features reach wider markets.
Conclusion
Integrated analytics tools give users a consolidated view of performance metrics drawn from multiple licensed wagering applications. By connecting directly to operator APIs and aligning with regulatory data standards, the systems deliver consistent calculations of win rates, ROI, and other indicators without manual reconciliation. As more jurisdictions finalize data-sharing rules and operators expand API access, the scope of what these tools can track continues to widen while privacy and security controls remain in place.